UPDATED APRIL 2021
PRE-CERTIFIED
LOCAL
HOUSING
DATA
FOR THE CITY OF
PALM DESERT

TABLE OF CONTENTS
I. POPULATION, EMPLOYMENT, AND HOUSEHOLDS
II. SPECIALIZED HOUSEHOLD NEEDS: LARGE
FAMILIES, SENIORS, AND FEMALE-HEADED
HOUSEHOLDS
III. PEOPLE EXPERIENCING HOMELESSNESS
IV. PEOPL
E WITH DISABILITIES, INCLUDING
DEVELOPMENTAL DISABILITIES
V. HOUSING STOCK CHARACTERISTICS
VI. OVERPAYMENT AND OVERCROWDING
VII. ASSISTED UNITS AT RISK OF CONVERSION
VIII. FINAL REGIONAL HOUSING NEEDS ALLOCATION
Pre-Certified Local Housing Data for Palm Desert
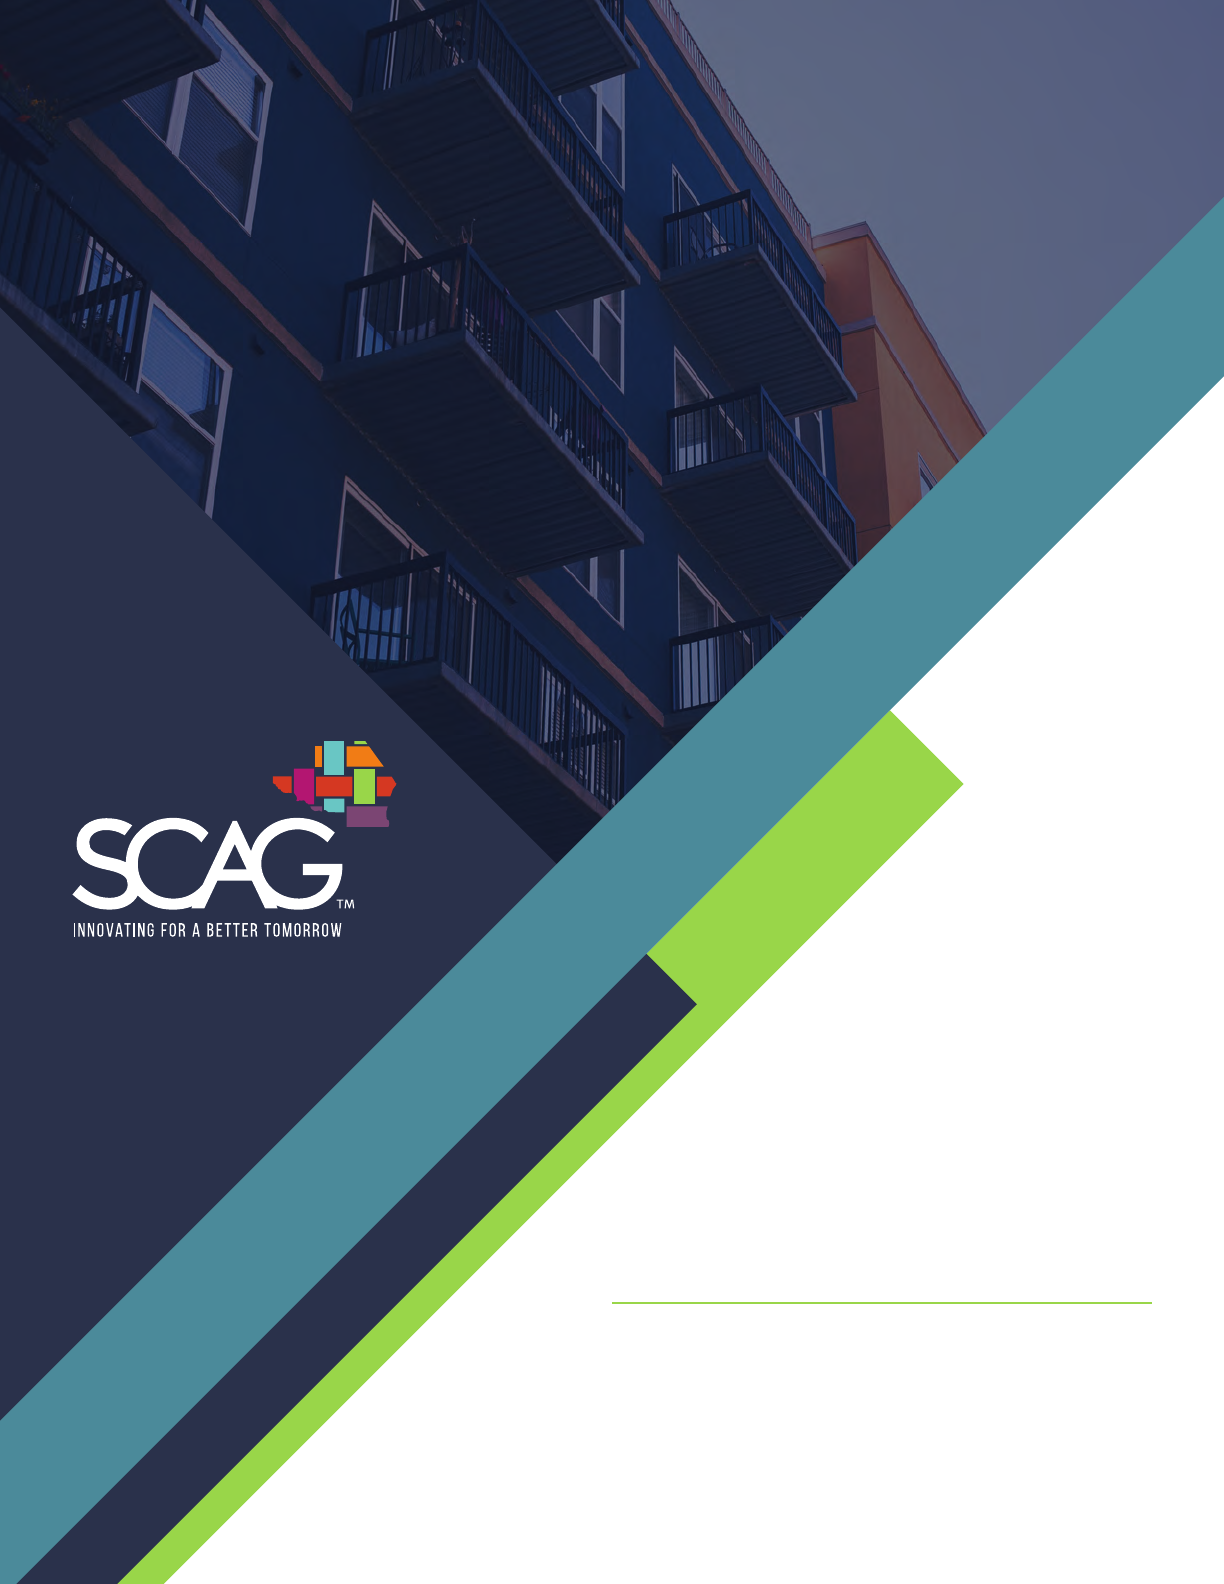
Population Trend, 2000-2020
I. POPULATION, EMPLOYMENT, AND HOUSEHOLDS
CA DOF E-5 Population and Housing Unit Estimates
Palm Desert has a 2020 total population of 52,986 including 308 living in group quarters according to the California Department of
Finance. The chart above describes the population trend in Palm Desert from 2000 to 2020. Over this period Palm Desert had an
annual growth rate of 1.3% compared to 0.7% for the region.
Developed by SCAG and pre-certified by the California Department of Housing and Community Development (HCD) for use in 6th
cycle housing elements.
This report contains a wide range of jurisdiction-level data elements intended to provide an understanding housing need
experienced in Palm Desert as a part of its 6th cycle housing element update. Data sources are noted below each table or figure.
0.0
10.0
20.0
30.0
40.0
50.0
60.0
2000 2005 2010 2015 2020
Palm Desert
41,155 47,422 48,445 51,250 52,986
SCAG
16,516,703 17,541,873 18,051,534 18,731,901 19,021,787
15.0
15.5
16.0
16.5
17.0
17.5
18.0
18.5
19.0
19.5
Thousands
Millions
LOCAL HOUSING DATA, 6TH CYCLE HOUSING ELEMENT UPDATE
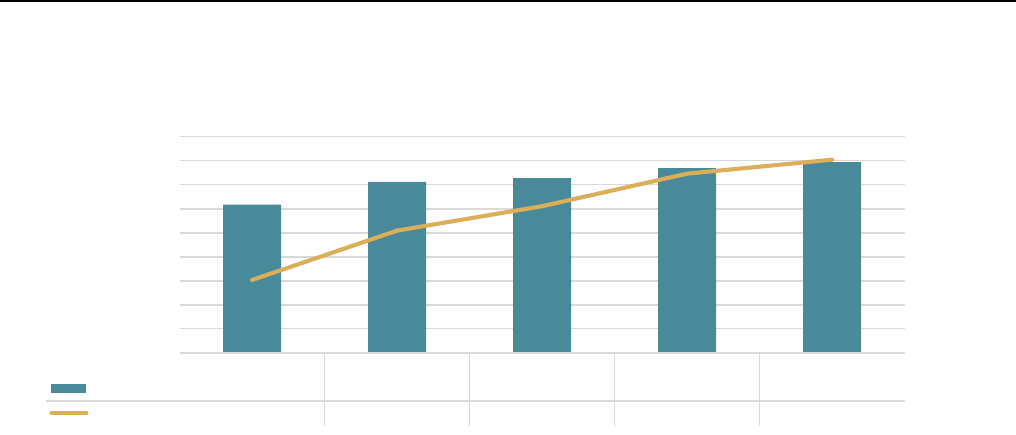
Current Population by Age and Sex
Employment by Industry
The population of Palm Desert is 48.2% male and 51.8% female. The share of the population of Palm Desert which is under 18
years of age is 14.8%, which is lower than the regional share of 23.4%. Palm Desert's seniors (65 and above) make up 33.7% of
the population, which is higher than the regional share of 13%.
American Community Survey 2014-2018 5-year estimates using groupings of 2-digit NAICS codes.
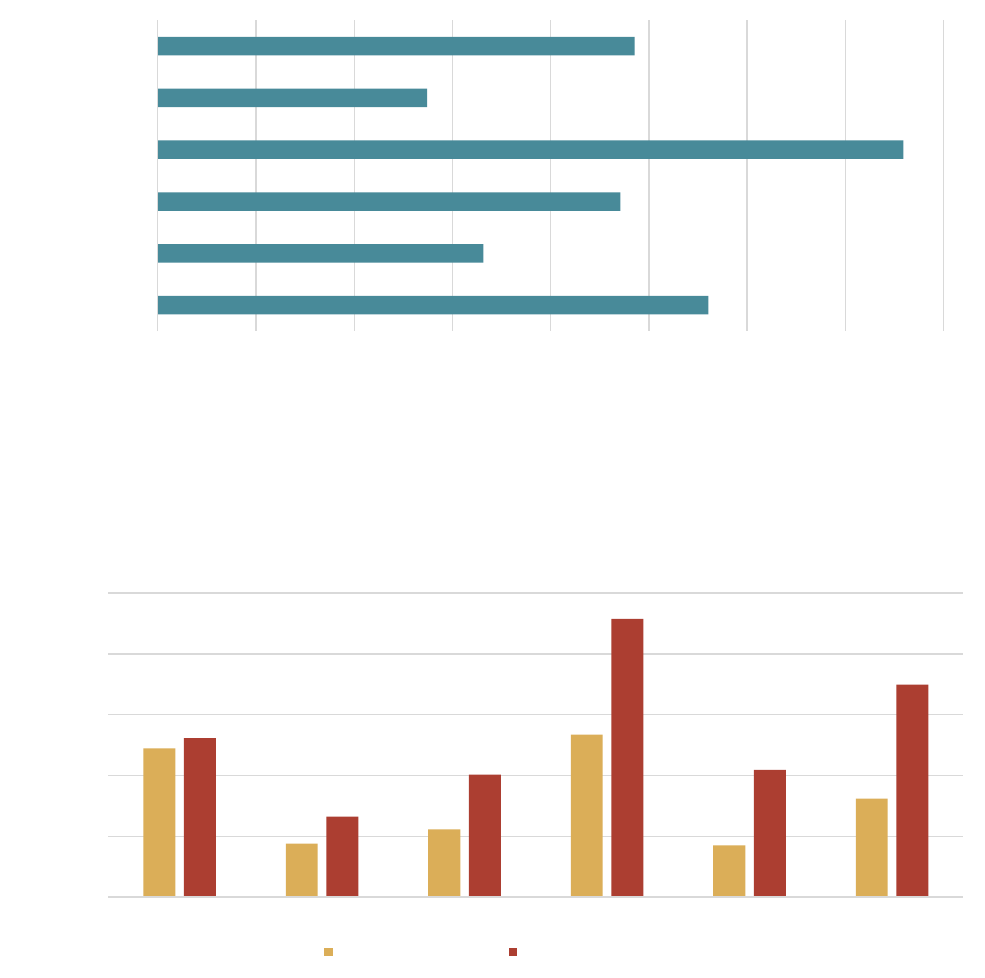
Palm Desert has 21,933 workers living within its borders who work across 13 major industrial sectors. The chart above provides
detailed employment information. The most prevalent industry is Arts, Entertainment, Recreation with 4,404 employees (20.1% of
total) and the second most prevalent industry is Education & Social Services with 4,133 employees (18.8% of total).
American Community Survey 2014-2018 5-year estimates
3,000
2,000
1,000
0
1,000
2,000
3,000
0-4 5-9 10-14 15-19 20-24 25-29 30-34 35-39 40-44 45-49 50-54 55-59 60-64 65-69 70-74 75-79 80-84 85+
Male Female
147
1,473
789
492
3,066
585
438
1,616
2,702
4,133
4,404
1,482
606
0 500 1,000 1,500 2,000 2,500 3,000 3,500 4,000 4,500 5,000
Agriculture
Construction
Manufacturing
Wholesale Rrade
Retail Trade
Transportation
Information
Finance
Professional Services
Education & Social Services
Arts, Entertainment, Recreation
Other
Public Admininstration
Prepared by SCAG, Updated April 2021 Page 2/18
LOCAL HOUSING DATA, 6TH CYCLE HOUSING ELEMENT UPDATE
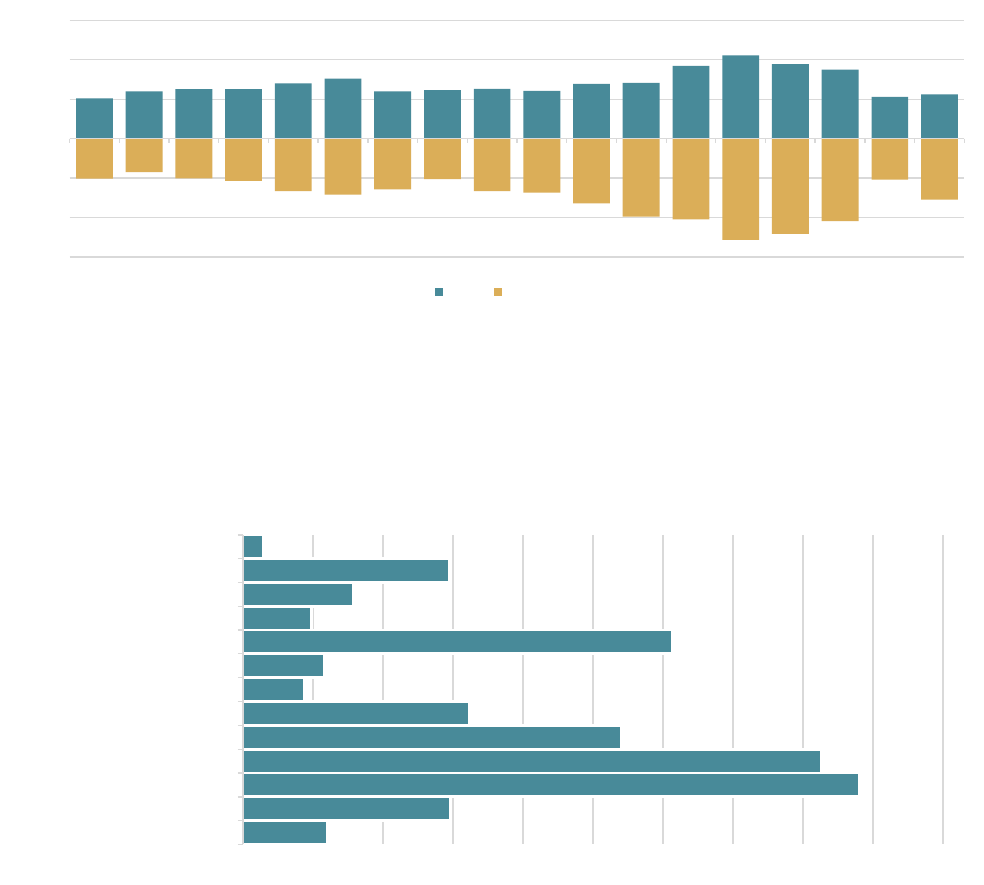
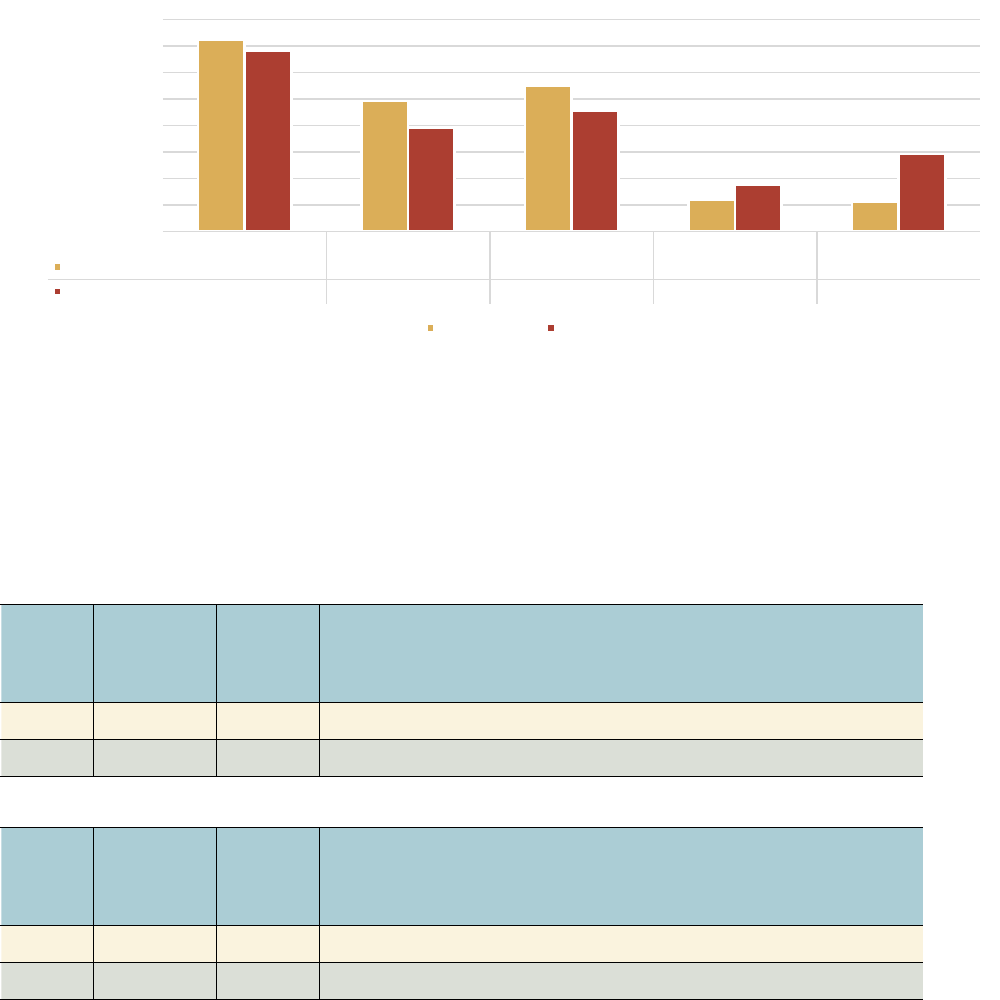
Employment by Occupation
Farmworkers
Farmworkers by Occupation:
Palm
Desert
Percent of
total Palm
Desert
workers:
SCAG Total
60 0.27% 57,741 Total jobs: Farming, fishing, and forestry occupations
50 0.36% 31,521 Full-time, year-round jobs: Farming, fishing, and forestry occupations
Employment in the Agricultural Industry:
Palm
Desert
Percent of
total Palm
Desert
workers:
SCAG Total
147 0.67% 73,778 Total in agriculture, forestry, fishing, and hunting
137 0.99% 44,979 Full-time, year-round in agriculture, forestry, fishing, and hunting
Statewide, farmworker housing is of unique concern and of unique importance. While only a small share of SCAG region
jurisdictions have farmworkers living in them, they are essential to the region's economy and food supply.
American Community Survey 2014-2018 5-year estimates using groupings of SOC codes.
In addition to understanding the industries in which the residents of Palm Desert work, it is also possible to analyze the types of
jobs they hold. The most prevalent occupational category in Palm Desert is Management, in which 7,926 (36.1% of total)
employees work. The second-most prevalent type of work is in Sales, which employs 6,048 (27.6% of total) in Palm Desert.
American Community Survey 2014-2018 5-year estimates using groupings of NAICS and SOC codes.
7,926
5,404
6,048
1,316
1,239
2,616,827
1,500,551
1,743,617
675,894
1,118,977
0.0%
5.0%
10.0%
15.0%
20.0%
25.0%
30.0%
35.0%
40.0%
Management Services Sales Natural Resources Production
Palm Desert
36.1% 24.6% 27.6% 6.0% 5.6%
SCAG
34.2% 19.6% 22.8% 8.8% 14.6%
Palm Desert SCAG
Prepared by SCAG, Updated April 2021 Page 3/18
LOCAL HOUSING DATA, 6TH CYCLE HOUSING ELEMENT UPDATE
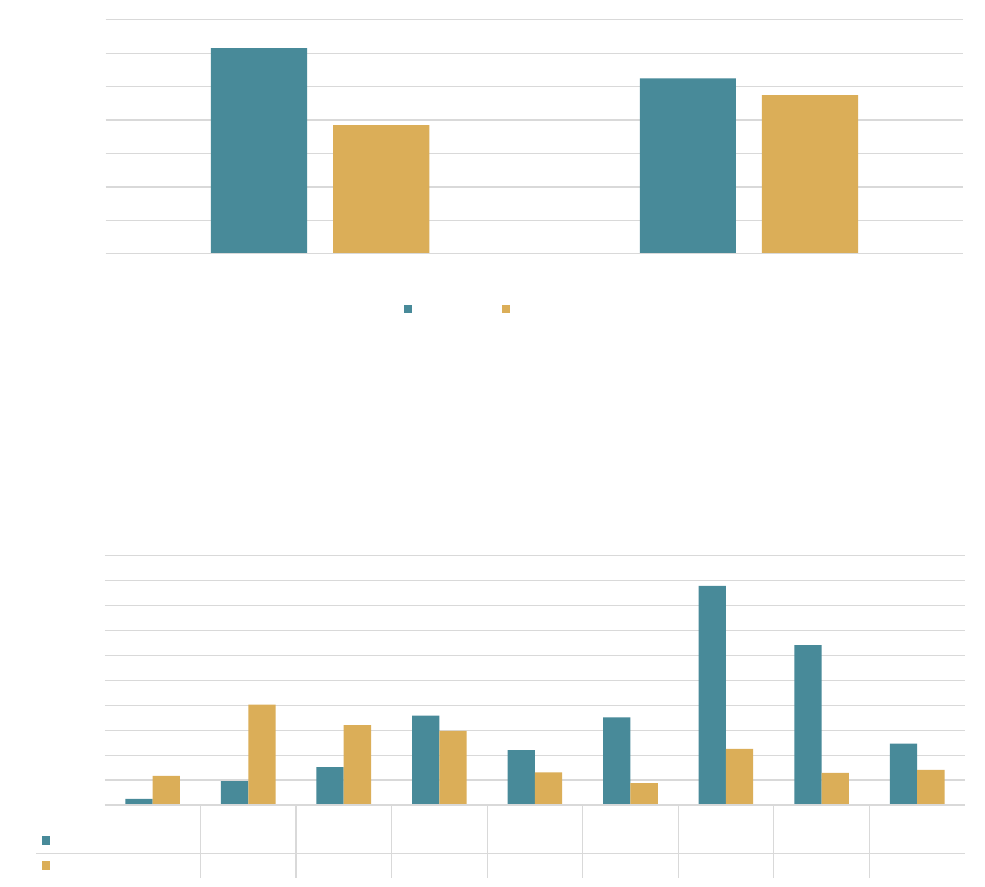
Housing Tenure
Housing Tenure By Age
American Community Survey 2014-2018 5-year estimates.
Housing security can depend heavily on housing tenure, i.e. whether homes are owned or rented. Palm Desert's housing stock
consists of 24,114 total units, 14,842 of which are owner-occupied and 9,272 of which are renter-occupied. The share of renters
in Palm Desert is lower than in the SCAG region overall.
American Community Survey 2014-2018 5-year estimates.
In many places, housing tenure varies substantially based on the age of the householder. In Palm Desert, the age group where
renters outnumber owners the most is 15-24 (by 64.6%). The age group where owners outnumber renters the most is 75-84 (by
66.4%).
61.5%
52.5%
38.5%
47.5%
0.0%
10.0%
20.0%
30.0%
40.0%
50.0%
60.0%
70.0%
Palm Desert SCAG
Percent of Total Households
Owner (%) Renter (%)
0
500
1,000
1,500
2,000
2,500
3,000
3,500
4,000
4,500
5,000
15-24 25-34 35-44 45-54 55-59 60-64 65-74 75-84 85+
Owner
126 480 763 1,789 1,105 1,755 4,389 3,203 1,232
Renter
586 2,016 1,602 1,491 660 439 1,124 647 707
Households
Prepared by SCAG, Updated April 2021 Page 4/18
LOCAL HOUSING DATA, 6TH CYCLE HOUSING ELEMENT UPDATE
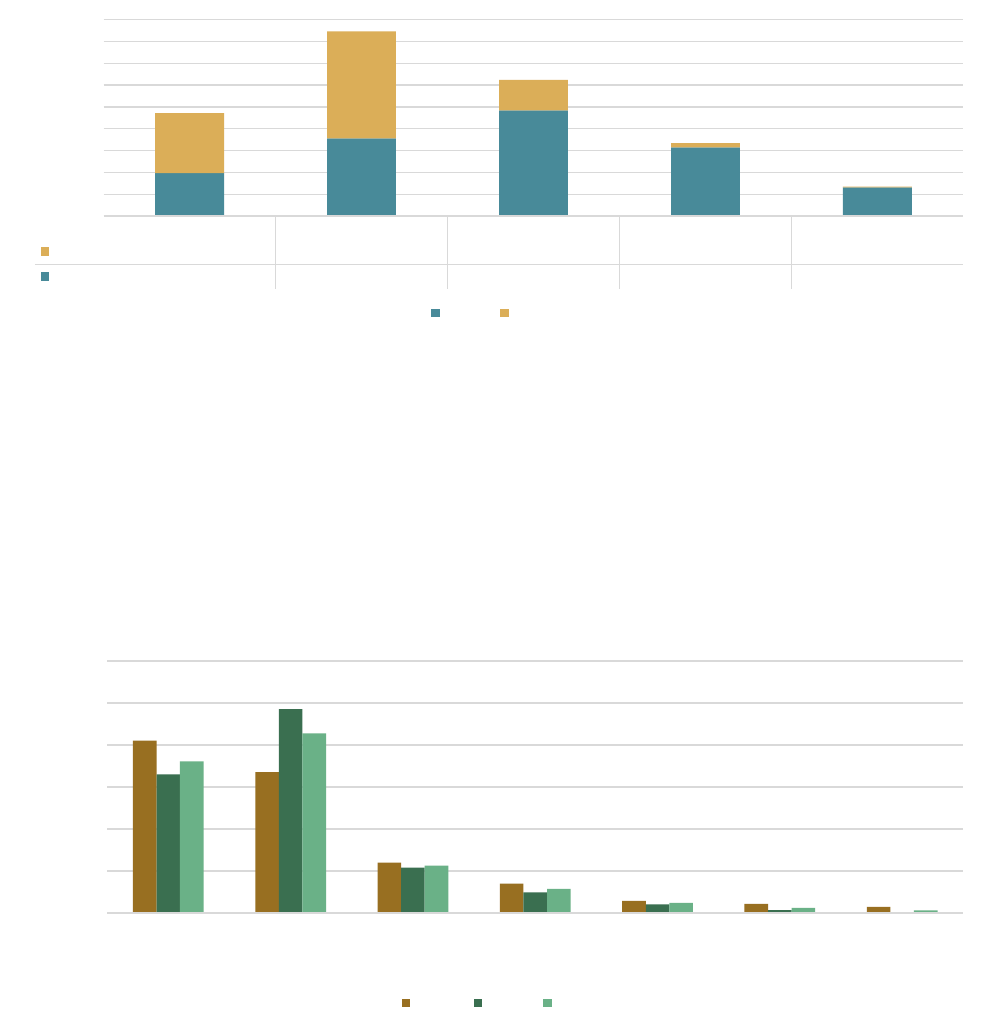
Housing Tenure by Year Moved to Current Residence
Households by Household Size
Across the SCAG region, the most common move-in period was 2010-2014 (31.9%) followed by 2000-2009 (26.1%). In Palm
Desert, the period during which most people started living in their current residence was 2010-2014 (35.1%) followed by 2000-
2009 (25.9%).
II. SPECIALIZED HOUSEHOLD NEEDS: LARGE FAMILIES, SENIORS, AND FEMALE-HEADED
American Community Survey 2014-2018 5-year estimates.
This chart illustrates the range of household sizes in Palm Desert for owners, renters, and overall. The most commonly occuring
household size is of two people (42.8%) and the second-most commonly occuring household is of one person (36.1%). Palm Desert
has a higher share of single-person households than the SCAG region overall (36.1% vs. 23.4%) and a lower share of 7+ person
households than the SCAG region overall (0.6% vs. 3.1%).
American Community Survey 2014-2018 5-year estimates.
19.5%
35.1%
25.9%
13.8%
5.6%
0
1,000
2,000
3,000
4,000
5,000
6,000
7,000
8,000
9,000
2015 or later 2010-2014 2000-2009 1990-1999 1989 or earlier
Renter
2,741 4,911 1,397 183 40
Owner
1,973 3,558 4,843 3,155 1,313
Households (% of total)
Owner Renter
3803
3108
1110
649
269
200
133
4897
7208
1602
724
302
94
15
8,700
10,316
2,712
1,373
571
294
148
0.0%
10.0%
20.0%
30.0%
40.0%
50.0%
60.0%
1 2 3 4 5 6 7+
Households (% by size category)
Number of People per Household
Renter Owner Total
Prepared by SCAG, Updated April 2021 Page 5/18
LOCAL HOUSING DATA, 6TH CYCLE HOUSING ELEMENT UPDATE
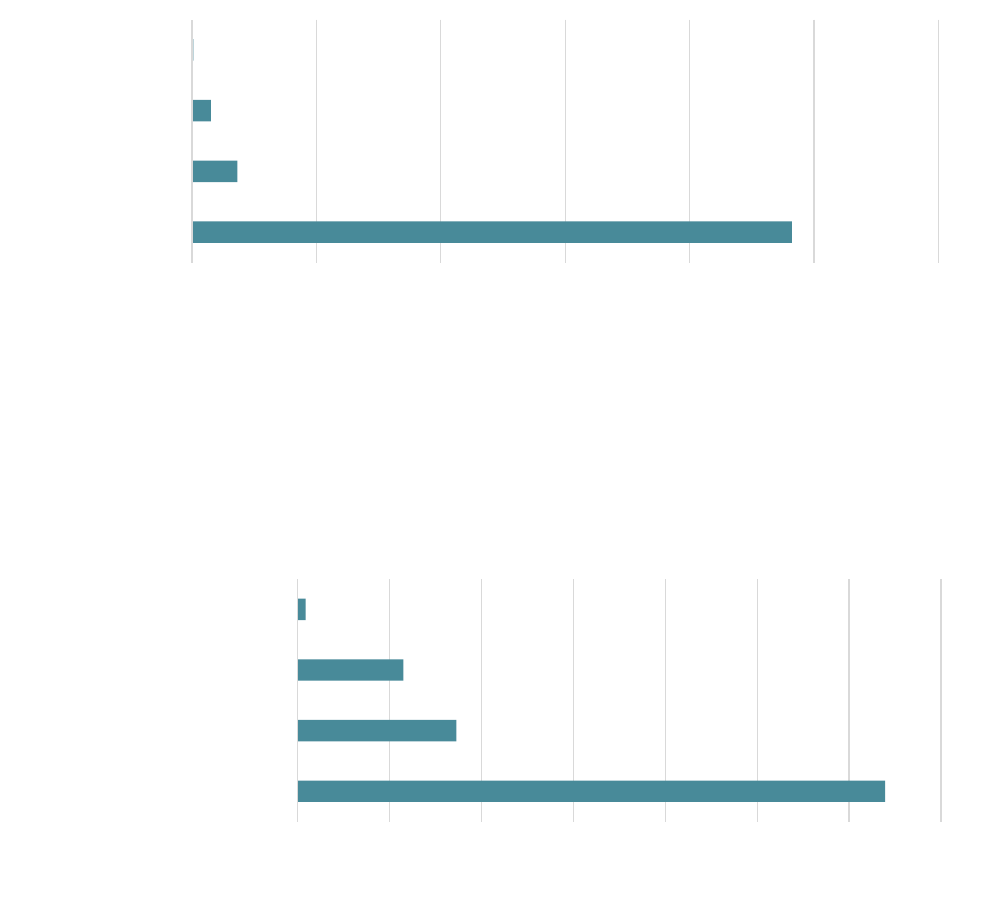
Female Headed Households (FHH)
Households by Poverty Status
American Community Survey 2014-2018 5-year estimates.
5.3 percent of Palm Desert's households are experiencing poverty, compared to 7.9 percent of households in the SCAG region.
Poverty thresholds, as defined by the ACS, vary by household type. More information can be found at M256. In 2018, a single
individual under 65 was considered in poverty with a money income below $13,064/year while the threshold for a family consisting
of 2 adults and 2 children was $25,465/year.
American Community Survey 2014-2018 5-year estimates.
Statute requires analysis of specialized housing needs, including female-headed households in an effort to ensure adequate
childcare or job training services. Of Palm Desert's 24,114 total households, 7.6% are female-headed (compared to 14.3% in the
SCAG region), 3.1% are female-headed and with children (compared to 6.6% in the SCAG region), and 0.2% are female-headed and
with children under 6 (compared to 1.0% in the SCAG region).
24114
7.6%; 1828
3.1%; 755
0.2%; 50
0 5000 10000 15000 20000 25000 30000
Total Households
Total FHH
FHH w/children
FHH w/children under 6
Percent of total househods; Number of households
5.3%; 1,278
1.4%; 345
1.0%; 230
0.1%; 17
0 200 400 600 800 1,000 1,200 1,400
Total households in poverty
Female-headed
Female-headed with children
Female-headed with 3 or more children
Percent of total households; Number of households
Prepared by SCAG, Updated April 2021 Page 6/18
LOCAL HOUSING DATA, 6TH CYCLE HOUSING ELEMENT UPDATE
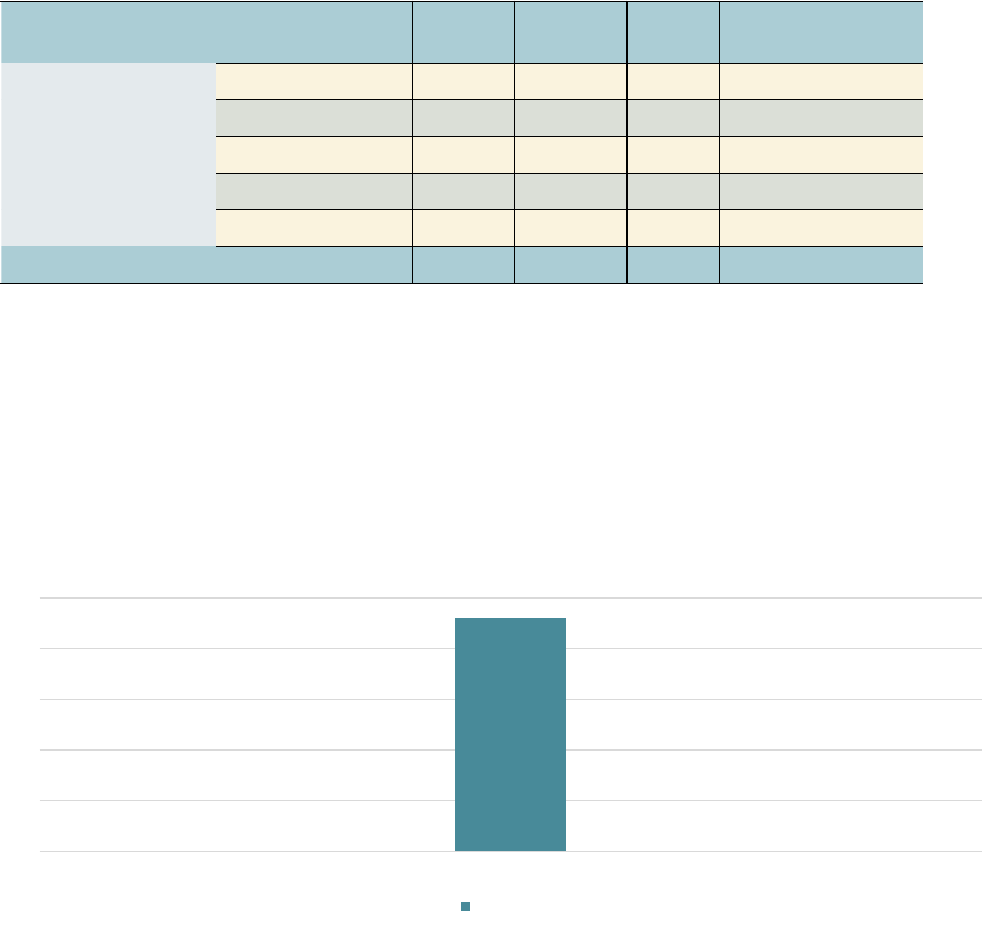
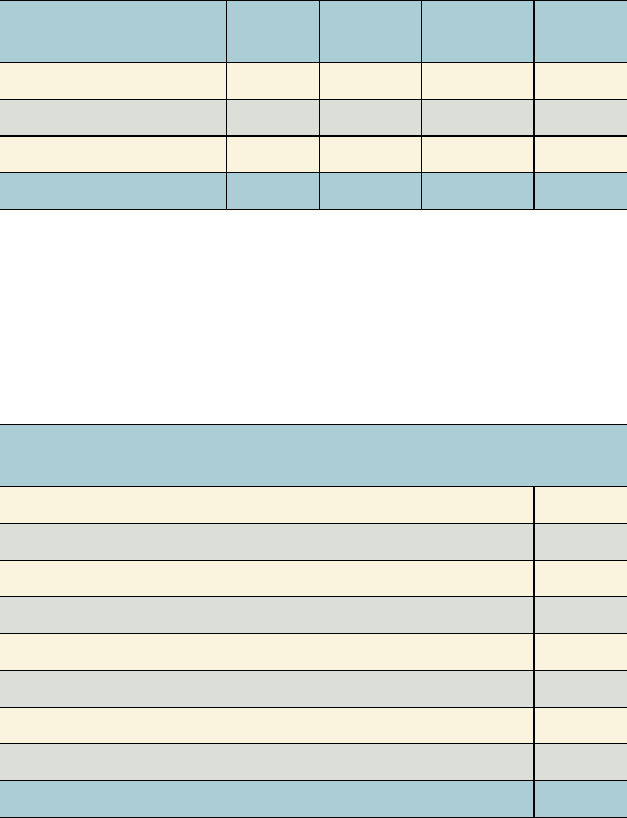
Elderly Households by Income and Tenure
Owner Renter Total
< 30% HAMFI 895 480 1,375
30-50% HAMFI 935 475 1,410
50-80% HAMFI 1,470 570 2,040
80-100% HAMFI 855 170 1,025
> 100% HAMFI 5,200 765 5,965
TOTAL 9,355 2,460 11,815
HUD CHAS, 2012-2016. HAMFI refers to Housing Urban Development Area Median Family Income.
Statute requires analysis of specialized housing needs, including housing needs for seniors. Federal housing data define a
household type as 'elderly family' if it consists of two persons with either or both age 62 or over. Of Palm Desert's 11,815 such
households, 11.6% earn less than 30% of the surrounding area income, (comared to 24.2% in the SCAG region), 23.6% earn less
than 50% of the surrounding area income (compared to 30.9% in the SCAG region).
III. PEOPLE EXPERIENCING HOMELESSNESS
2019 city and county homelessness point-in-time counts processed by SCAG. Jurisdiction-level counts were not avialable in Imperial County and
sheltered population (and thus total) counts were not available in Riverside County. As a result, SCAG region totals from this compilation of data
sources likely undercount true totals.
#N/A
Percent of Total Elderly
Households:
Income category, relative
to surrounding area:
11.6%
11.9%
17.3%
8.7%
50.5%
0
23
0
Sheltered Unsheltered Total
Palm Desert
Prepared by SCAG, Updated April 2021 Page 7/18
LOCAL HOUSING DATA, 6TH CYCLE HOUSING ELEMENT UPDATE
Disability by Type
Disability by Type - Seniors (65 and over)
IV. PEOPLE WITH DISABILITIES, INCLUDING DEVELOPMENTAL DISABILITIES
American Community Survey 2014-2018 5-year estimates.
Disability data also provides valuable context for assessing current and future need for accessible housing units. Note that since
some disability types are not recorded for children below a certain age, calculating disability as a percentage of total population
may not be accurate.
American Community Survey 2014-2018 5-year estimates.
In Palm Desert, the most commonly occuring disability amongst seniors 65 and older was an ambulatory disability, experienced by
13.3% of Palm Desert's seniors (and 22.9% of seniors in the SCAG region).
2,803
1,658
2,355
3,794
1,371
2,427
0 500 1,000 1,500 2,000 2,500 3,000 3,500 4,000
Hearing
Vision
Cognitive
Ambulatory
Self-care
Independent Living
12.2%
4.4%
5.6%
13.3%
4.3%
8.1%
13.1%
6.6%
10.1%
22.9%
10.5%
17.5%
0.0%
5.0%
10.0%
15.0%
20.0%
25.0%
Hearing Vision Cognitive Ambulatory Self-care Independent Living
Percent of Senior Population
Palm Desert Percent SCAG Region Percent
Prepared by SCAG, Updated April 2021 Page 8/18
LOCAL HOUSING DATA, 6TH CYCLE HOUSING ELEMENT UPDATE
Disability by Employment Status
With a
Disability
Percent of
Total
No Disability
Percent of
Total
Employed 1,397 49% 17,395 73%
Unemployed 122 4% 928 4%
Not in Labor Force 1,328 47% 5,603 23%
TOTAL 2,847 23,926
Developmental Disabilities
Palm Desert
By Residence: Home of Parent/Family/Guardian 175
Independent/Supported Living 28
Community Care Facility 5
Intermediate Care Facility 5
Foster/Family Home 5
Other 5
By Age: 0 - 17 Years 223
18+ Years 91
TOTAL 537
American Community Survey 2014-2018 5-year estimates.
Understanding the employment status of people with disabilities may also be an important component in evaluating specialized
housing needs. In Palm Desert, 49.1% of the population with a disability is employed, compared to 72.7% of the non-disabled
population.
CA DDS consumer count by CA ZIP, age group and residence type for the end of June 2019. Data available in 161/197 SCAG jurisdictions.
The California Department of Developmental Services also provides data on developmental disabilities by age and type of
residence. These data are collected at the ZIP-code level and were joined to the jurisdiction-level by SCAG. Totals may not match as
counts below 11 individuals are unavailable and some entries were not matched to a ZIP code necessitating approximation.
Prepared by SCAG, Updated April 2021 Page 9/18
LOCAL HOUSING DATA, 6TH CYCLE HOUSING ELEMENT UPDATE
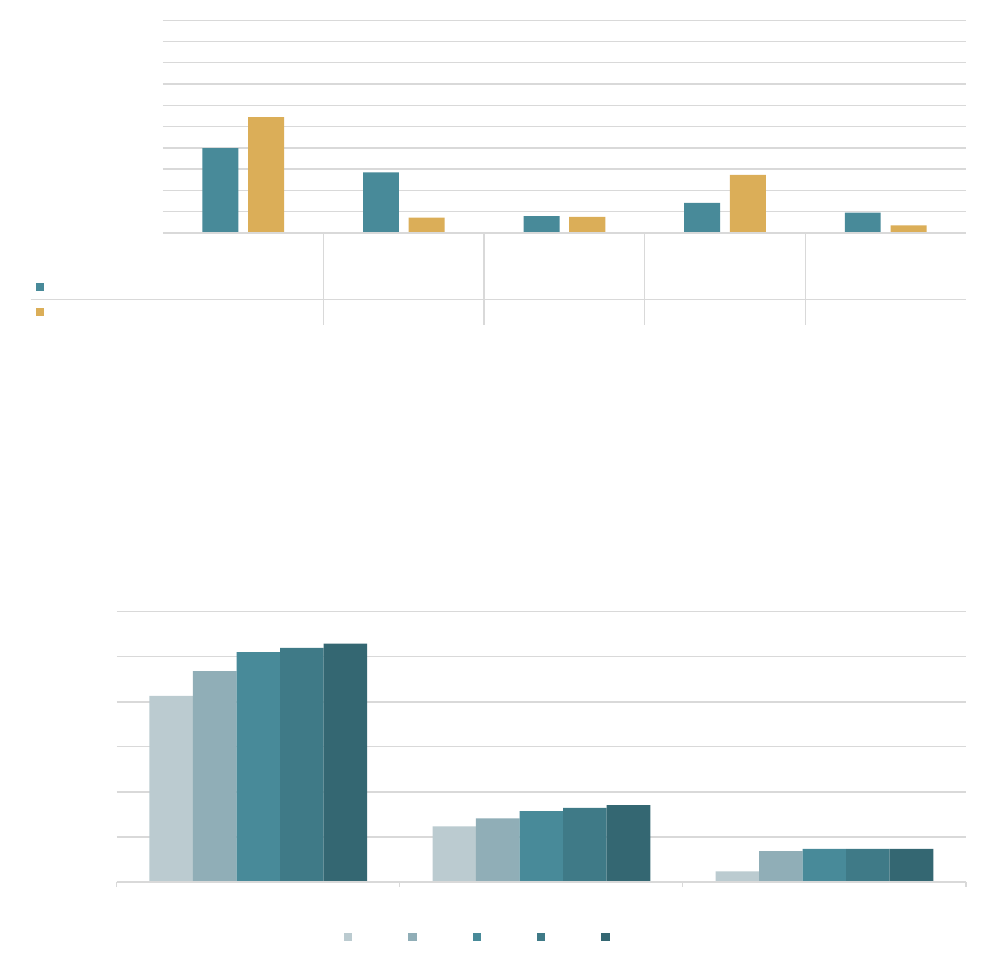
Housing Type
Housing Type Trend
The chart above provides detailed information on the housing stock in Palm Desert, which has a total of 38,677 housing units. The
most prevalent housing type in Palm Desert is single-family detached with 15,427 units. The share of all single-family units in Palm
Desert is 68.3%, which is higher than the 61.7% share in the SCAG region. Out of the total housing units in Palm Desert, there are
24,555 occupied-units, which equates to a 36.5% total vacancy rate. The average household size (as expressed by the population
to housing unit ratio) is 2.145.
CA DOF E-5 Population and Housing Unit Estimates
Over the past two decades (2000-2020), there has been more construction of single-family residential units than multi-family
residential units in Palm Desert. When comparing 2000 to 2020, SFR units increased by 5,797, MFR units increased by 2,352,
and mobile units increased by 2,507.
V. HOUSING STOCK CHARACTERISTICS
CA DOF E-5 Population and Housing Unit Estimates
15,427
11,004
3,052
5,490
3,704
0%
10%
20%
30%
40%
50%
60%
70%
80%
90%
100%
Single-Family
Detached
Single-Family
Attached
Multifamily, 2-4
Units
Multifamily, 5+
Units
Mobile Homes
Palm Desert (%)
39.9% 28.5% 7.9% 14.2% 9.6%
SCAG (%)
54.4% 7.2% 7.5% 27.3% 3.5%
Percent of Total Units
20,634
6,190
1,197
23,398
7,076
3,438
25,487
7,882
3,704
25,972
8,229
3,704
26,431
8,542
3,704
0
5,000
10,000
15,000
20,000
25,000
30,000
Single-Family Residential (SFR) Multifamily Residential (MFR) Mobile Homes
Housing Units
2000 2005 2010 2015 2020
Prepared by SCAG, Updated April 2021 Page 10/18
LOCAL HOUSING DATA, 6TH CYCLE HOUSING ELEMENT UPDATE
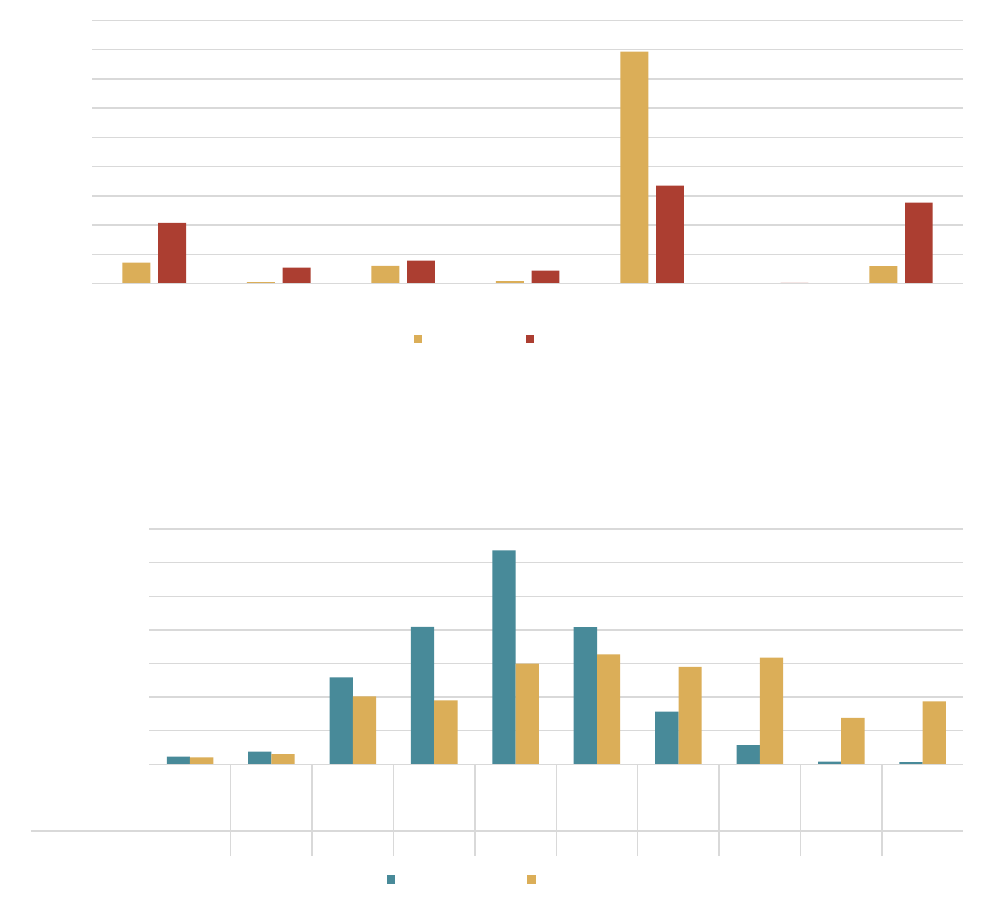
Vacant Units by Type
Housing Units by Year Structure Built
Examining the age of the current housing stock is one way to understand how historical development patterns have contributed to a
city's form. The time period where the highest share of Palm Desert's housing units were built is 1980-1989, while in the SCAG
region more units were built during 1970-1979 than any other period.
American Community Survey 2014-2018 5-year estimates.
The ACS provides additional detail on vacant housing units by category.
American Community Survey 2014-2018 5-year estimates.
7.2%
0.5%
6.1%
0.9%
79.3%
0.0%
5.9%
20.7%
5.4%
7.9%
4.5%
33.5%
0.3%
27.7%
0%
10%
20%
30%
40%
50%
60%
70%
80%
90%
For Rent Rented For Sale Sold Seasonal Migrant Other
Percent of Total Vacant Units
Palm Desert SCAG
0%
5%
10%
15%
20%
25%
30%
35%
2014 &
Later
2010-
2013
2000-
2009
1990-
1999
1980-
1989
1970-
1979
1960-
1969
1950-
1959
1940-
1949
1939 &
Earlier
Palm Desert (%)
1.1% 1.9% 12.9% 20.5% 31.8% 20.4% 7.8% 2.9% 0.4% 0.3%
SCAG (%)
1.0% 1.5% 10.1% 9.5% 15.0% 16.3% 14.5% 15.9% 6.9% 9.3%
Percent of Total Units
Palm Desert (%) SCAG (%)
Prepared by SCAG, Updated April 2021 Page 11/18
LOCAL HOUSING DATA, 6TH CYCLE HOUSING ELEMENT UPDATE
Substandard Housing
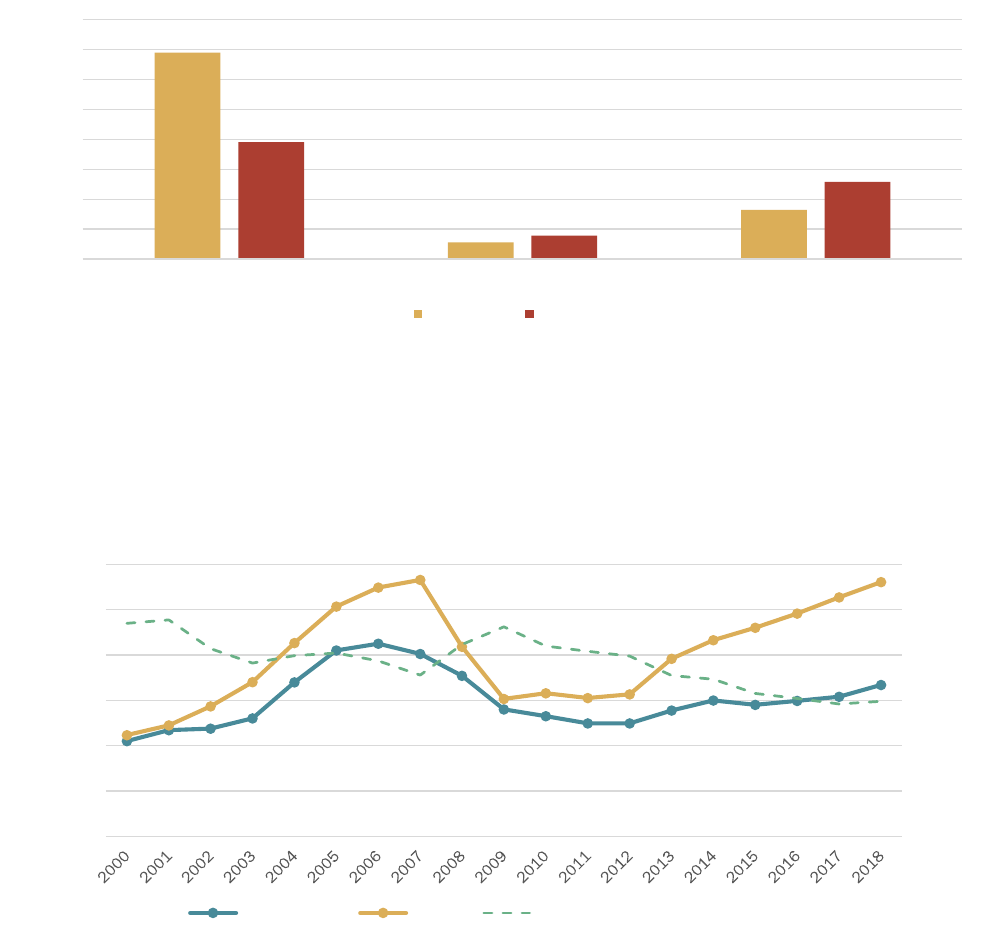
Median Home Sales Price for Existing Homes
American Community Survey 2014-2018 5-year estimates.
The ACS includes surveys about three factors of what may be considered substandard housing. In Palm Desert, 832 units lack
telephone service, 67 units lack plumbing facilities, and 198 units lack complete kitchen facilities.
SCAG Local Profiles, Core Logic/Data Quick. SCAG median home sales price calculated as household-weighted average of county medians.
Between 2000 and 2018, median home sales prices in Palm Desert increased 59% while prices in the SCAG region increased
151%. 2018 median home sales prices in Palm Desert were $334,000 and the highest experienced since 2000 was $425,000 in
2006. Prices in Palm Desert have ranged from a low of 58.4% of the SCAG region median in 2017 and a high of 95.5% in 2001.
3.45%
0.28%
0.82%
1.95%
0.39%
1.29%
0%
1%
1%
2%
2%
3%
3%
4%
4%
No Telephone Service Available Lacking Plumbing Facilities Lacking Complete Kitchen Facilities
Percent of Total Units
Palm Desert SCAG
0.0%
20.0%
40.0%
60.0%
80.0%
100.0%
120.0%
$-
$100,000
$200,000
$300,000
$400,000
$500,000
$600,000
Palm Desert SCAG Palm Desert Percentage of SCAG Price
Prepared by SCAG, Updated April 2021 Page 12/18
LOCAL HOUSING DATA, 6TH CYCLE HOUSING ELEMENT UPDATE
Housing Units Permitted
Crowding by Extent and Tenure
VI. OVERPAYMENT AND OVERCROWDING
American Community Survey 2014-2018 5-year estimates.
In Palm Desert, 218 owner-occupied and 741 renter-occupied households had more than 1.0 occupants per room, which meets
the ACS definition for overcrowding. 91 owner-occupied households and 326 renter-occupied households had more than 1.5
occupants per room, which meets the ACS definition for severe overcrowding.
Core Logic/Data Quick. Additional detail available in SCAG 2019 Local Profiles. SCAG median home sales price calculated as household-weighted
average of county medians.
1.5%
0.6%
8.0%
3.5%
4.9%
1.3%
15.6%
6.4%
0.0%
2.0%
4.0%
6.0%
8.0%
10.0%
12.0%
14.0%
16.0%
18.0%
1.0+/room 1.5+/room 1.0+/room 1.5+/room
Owner Owner Renter Renter
Percent of Total Households
Palm Desert SCAG
0.0
5.0
10.0
15.0
20.0
25.0
0
100
200
300
400
500
600
700
800
2000 2002 2004 2006 2008 2010 2012 2014 2016 2018
Units permitted per 1000 population
Units Permitted in Jurisdiction
All Units Single-Family Units
Multifamily Units Palm Desert, all units per 1000 Pop.
SCAG, Units per 1000 Pop.
Prepared by SCAG, Updated April 2021 Page 13/18
LOCAL HOUSING DATA, 6TH CYCLE HOUSING ELEMENT UPDATE
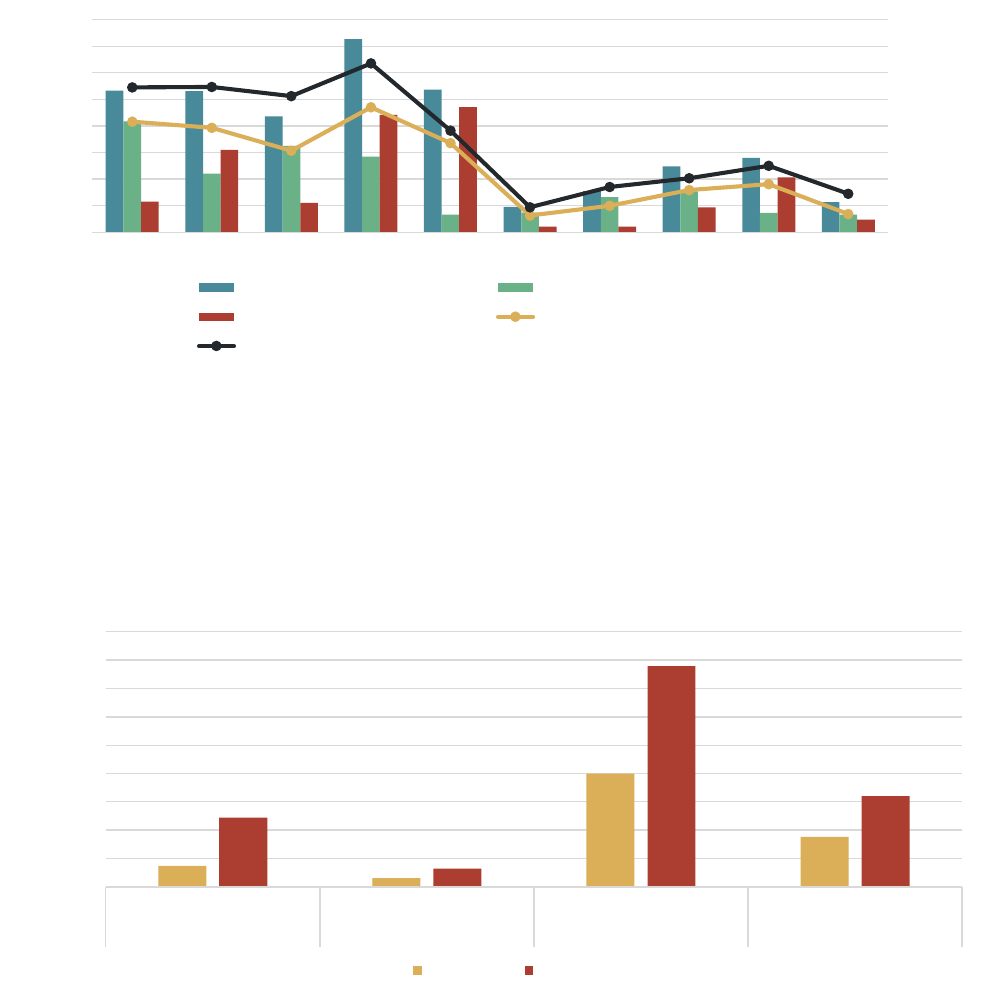
Cost Burden by Income
Income < 30% 30-50% > 50%
< 30% HAMFI 120 244 2,055
30-50% HAMFI 414 770 1,234
50-80% HAMFI 1,670 1,580 1,015
80-100% HAMFI 1,240 595 260
> 100% HAMFI 10,260 1,545 330
Total Households 13,704 4,734 4,894
Spending on Rent
Housing cost burden is most commonly measured as the percentage of gross income spent on housing, with 30% a usual threshold
for 'cost burden' and 50% the threshold for 'severe cost burden.' However, a lower-income household spending the same percent of
income on housing as a higher-income household will likely experience more true 'cost burden.' These data indicate the number of
households in Palm Desert by their income relative to the surrounding area and their share of income spent on housing.
Across Palm Desert's 9,272 renter households, 4,600 (49.6%) spend thirty percent or more of gross income on housing cost,
compared to 55.3% in the SCAG region. Additionally, 2,436 renter households in Palm Desert (26.3%) spend fifty percent or more
of gross income on housing cost, compared to 28.9% in the SCAG region.
Households by Share of Income
Spent on Housing Cost:
HUD CHAS, 2012-2016. HAMFI refers to Housing Urban Development Area Median Family Income.
233
609
837
1,093
1,444
590
741
833
2,436
456
0
500
1,000
1,500
2,000
2,500
3,000
<10% 10-15% 15-20% 20-25% 25-30% 30-35% 35-40% 40-49% >50% Not
Computed
Number of Households
Percent of Income Spent on Rent
Prepared by SCAG, Updated April 2021 Page 14/18
LOCAL HOUSING DATA, 6TH CYCLE HOUSING ELEMENT UPDATE
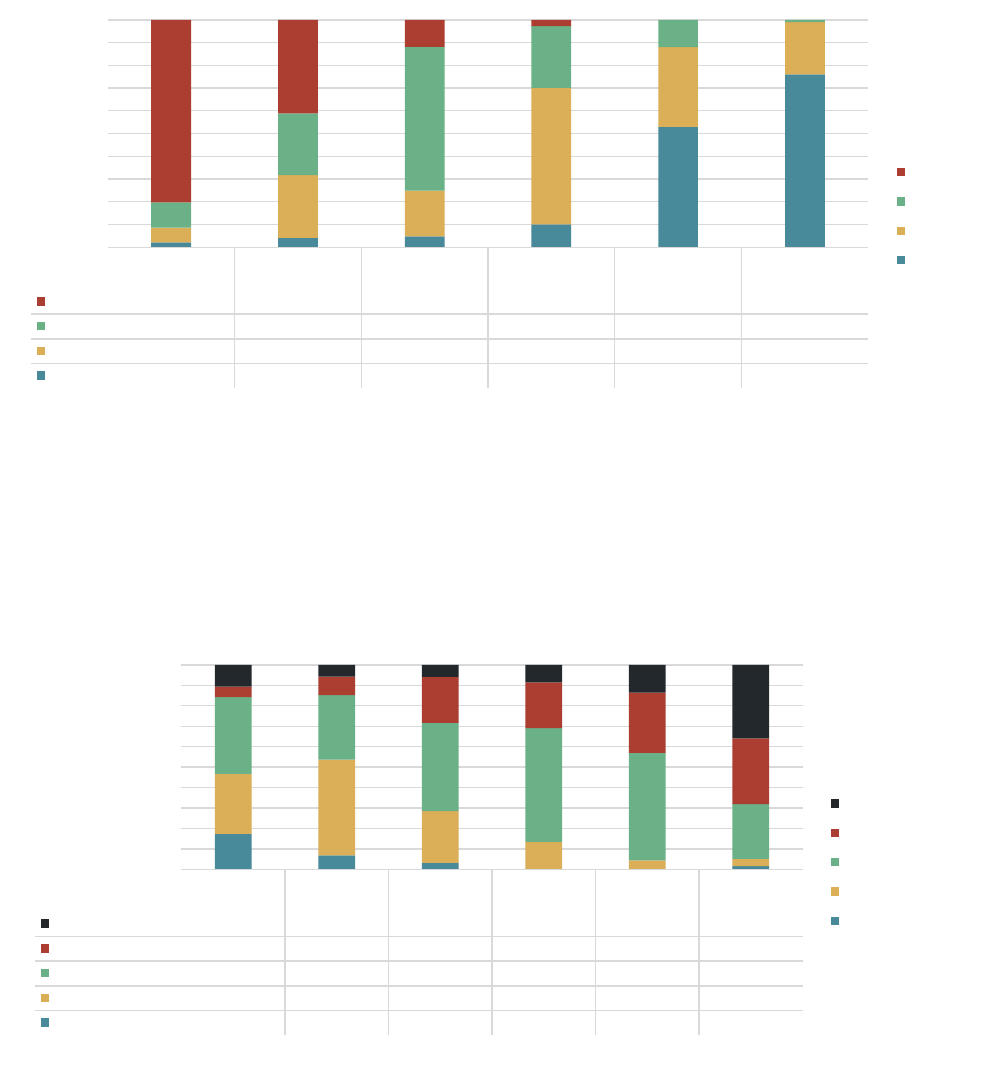
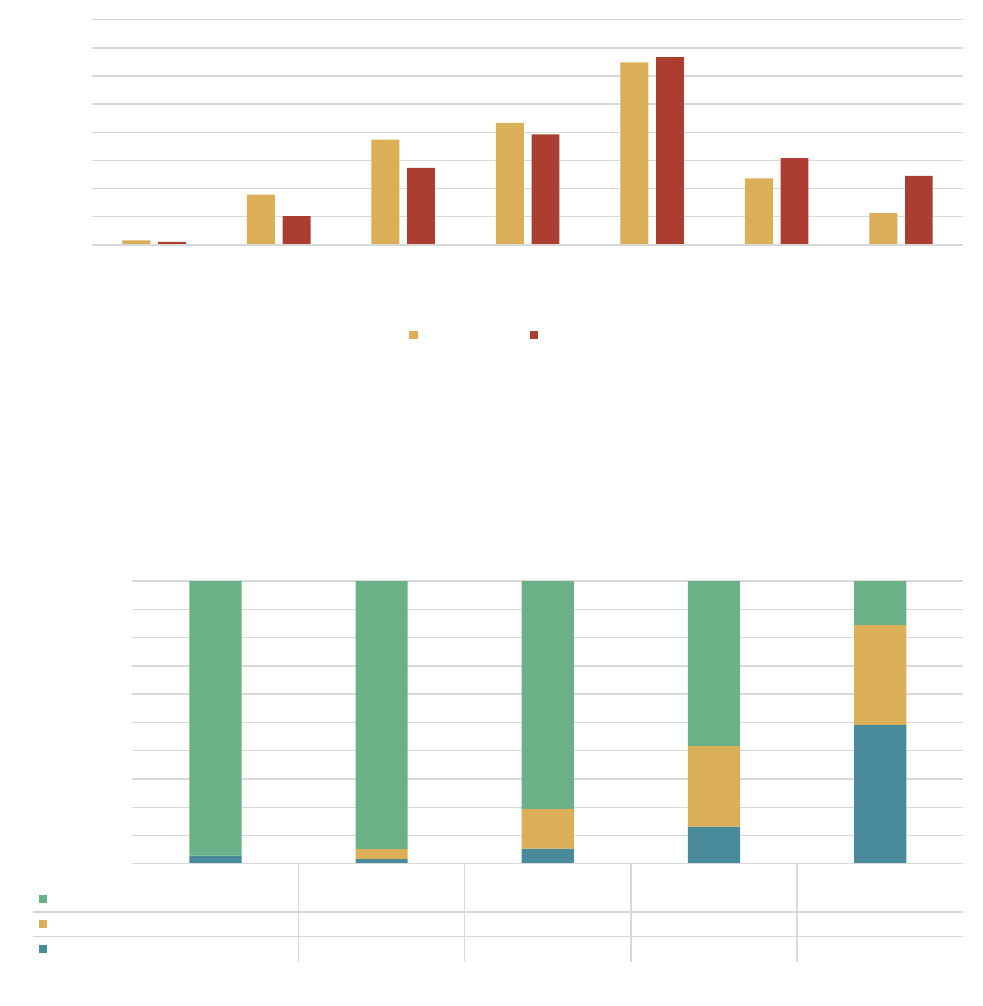
Spending on Rent by Income
Household Income by (Cash) Rent
American Community Survey 2014-2018 5-year estimates.
While the previous table breaks down cost burden by area-relative income, the ACS also allows for the analysis of Palm Desert's
8,816 renter households (for which income data are available) by spending on rent by income bracket (dollar amounts). As one
might expect, the general trend is that low-income households spend a higher share of income on housing (e.g. over 50%) while
high-income households are more likely to spend under 20% of income on housing.
American Community Survey 2014-2018 5-year estimates.
Palm Desert renter households' cash rent paid can be broken down by household incomes. As one might expect, the general trend
is that lower-income households spend less on rent while higher-income households spend more on rent, though this may not be
universally true. Rent categories range from <$500/month (6% of Palm Desert renters) to >$2000/month (12% of Palm Desert
renters). The most common rent category in Palm Desert is $1000-1500/month with 40.8% of renters.
0%
10%
20%
30%
40%
50%
60%
70%
80%
90%
100%
Less than
$20,000
$20,000 to
$34,999
$35,000 to
$49,999
$50,000 to
$74,999
$75,000 to
$99,999
$100,000 or
more
>50%
1,494 730 162 50 0 0
30-49%
207 481 865 496 103 12
20-29%
119 490 275 1,092 302 259
<20%
41 73 65 184 455 861
Number of Renter Households
Income Category
>50%
30-49%
20-29%
<20%
0%
10%
20%
30%
40%
50%
60%
70%
80%
90%
100%
Less than
$20,000
$20,000 to
$34,999
$35,000 to
$49,999
$50,000 to
$74,999
$75,000 to
$99,999
$100,000
or more
>$2000/mo.
215 103 80 156 117 406
$1500-2000/mo.
106 161 309 408 253 364
$1000-1500/mo.
759 558 587 1010 451 302
$500-1000/mo.
594 829 346 248 39 41
<$500/mo.
353 123 45 0 0 19
Renter Households
Income
>$2000/mo.
$1500-2000/mo.
$1000-1500/mo.
$500-1000/mo.
<$500/mo.
Prepared by SCAG, Updated April 2021 Page 15/18
LOCAL HOUSING DATA, 6TH CYCLE HOUSING ELEMENT UPDATE
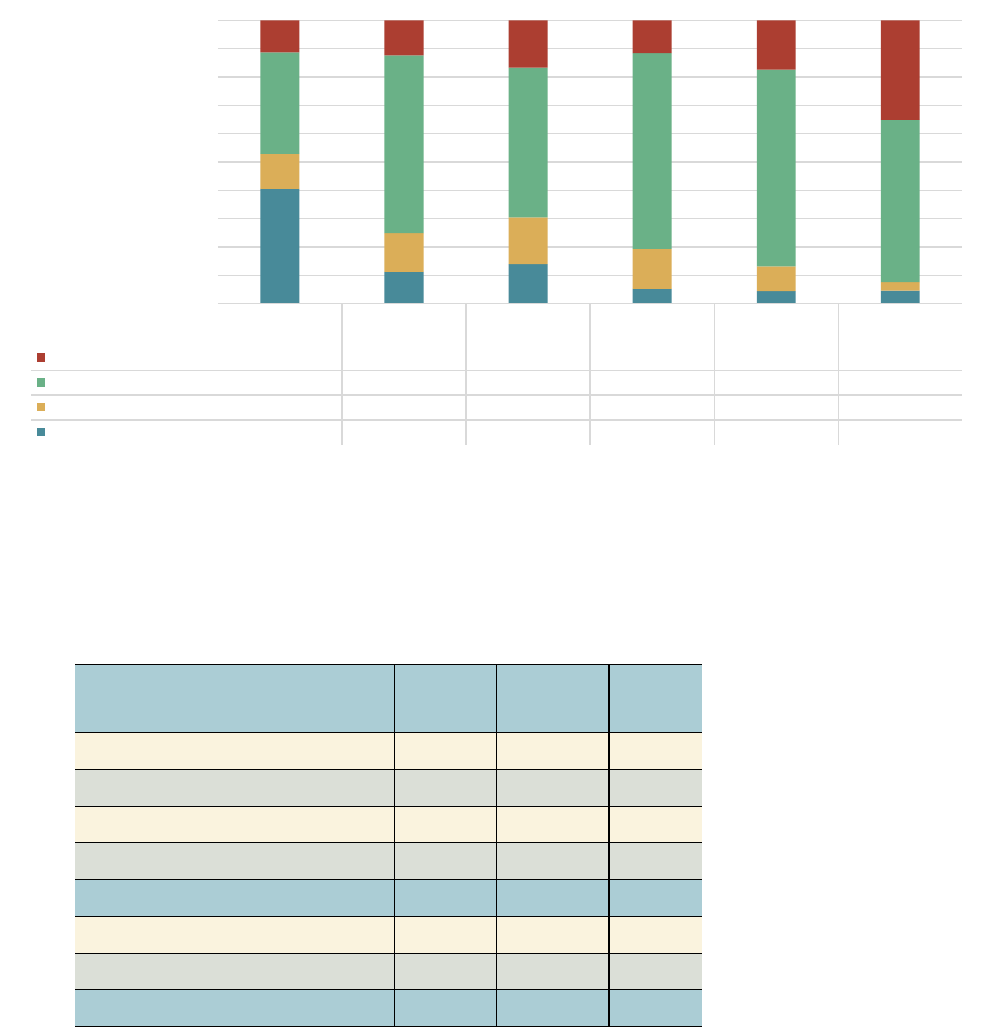
Monthly Owner Costs for Mortgage Holders
Costs for Mortgage Holders by Income
American Community Survey 2014-2018 5-year estimates.
While renter households receive much of the focus when it comes to housing cost analysis, owner households make up 61.5% of
Palm Desert and 52.5% of the SCAG region. The most commonly occurring mortgage payment in Palm Desert is $2000-
$3000/month and the most commonly occuring mortgage payment in the SCAG region is $2000-$3000/mo.
Mortgage-holding households in Palm Desert can be broken down by income and the percentage of income spent on mortgage
costs. As one might expect, the general trend is that lower-income households spend a higher share of income on housing costs,
while high-income households may spend a lower share of income on housing.The income category most prevalent amongst Palm
Desert mortgage-holding households is $75,000 or more (4,512 households) and the most prevalent share of income spent on
mortgage costs is over 30% (3,475 households).
0.8%
8.9%
18.7%
21.7%
32.4%
11.8%
5.6%
0.5%
5.1%
13.7%
19.6%
33.4%
15.4%
12.3%
0%
5%
10%
15%
20%
25%
30%
35%
40%
<$500 $500-$1000 $1000-$1500 $1500-$2000 $2000-$3000 $3000-$4000 >$4000
Pct. of mortgage
-holders
Mortgage - Monthly Payment
Palm Desert SCAG
0%
10%
20%
30%
40%
50%
60%
70%
80%
90%
100%
Less than $20,000 $20,000 to $34,999 $35,000 to $49,999 $50,000 to $74,999 $75,000 or more
Over 30%
549 780 603 844 699
20-29%
0 29 105 413 1597
Under 20%
16 14 40 190 2216
Mortgage
-holding households
Household Income; Percent of income spent on mortgage costs
Prepared by SCAG, Updated April 2021 Page 16/18
LOCAL HOUSING DATA, 6TH CYCLE HOUSING ELEMENT UPDATE
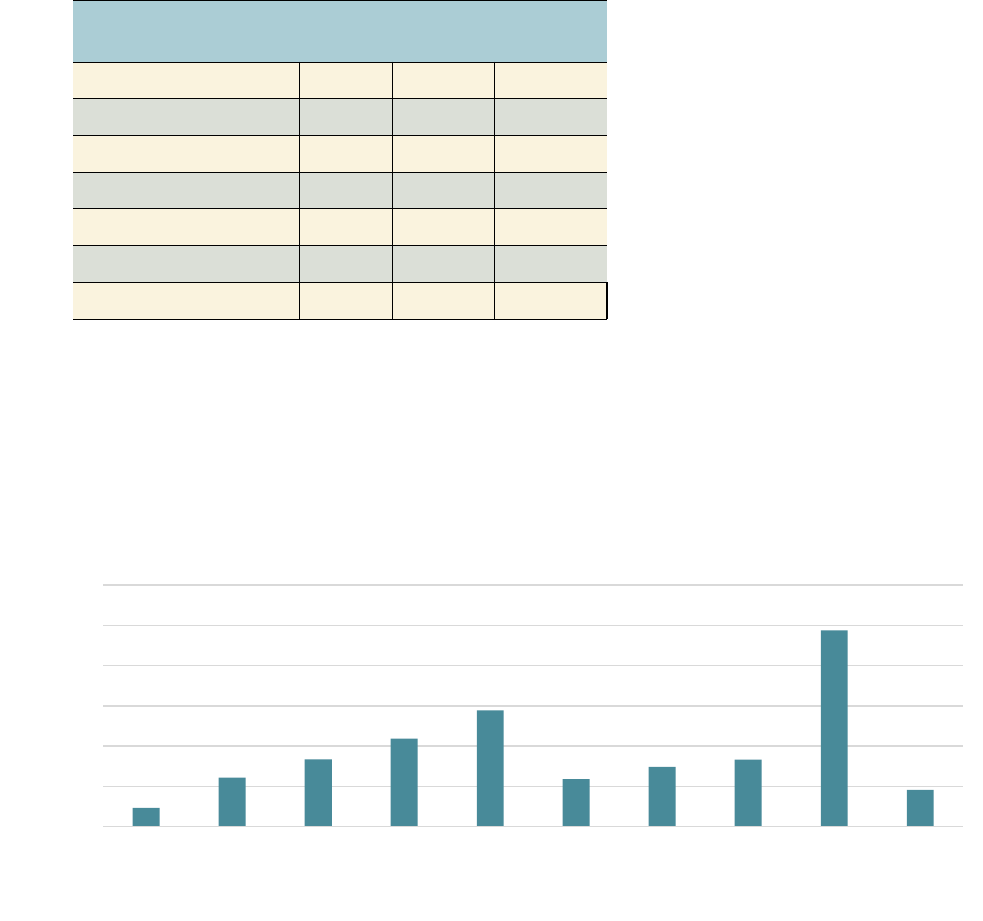
Household Income by Home Value (for owned units)
Extremely Low Income Housing Needs
Total
Households
Households
below 30%
HAMFI
Share
below 30%
HAMFI
White, non-Hispanic 17,915 2,030 11.3%
Black, non-Hispanic 363 15 4.1%
Asian and other, non-Hispanic 1,332 200 15.0%
Hispanic 4,120 570 13.8%
TOTAL 23,730 2,815 11.9%
Renter-occupied 9,455 1,545 16.3%
Owner-occupied 14,270 1,270 8.9%
TOTAL 23,725 2,815 11.9%
Another approach to evaluating the relationship between housing and income is to compare incomes and home values in Palm
Desert. The most commonly-occuring income category amongst owner households in Palm Desert is $100,000 or more (5,365
households) and the most commonly-occuring home value category is $200,000 to $500,000 (8,928 households).
HUD CHAS, 2012-2016. HAMFI refers to Housing Urban Development Area Median Family Income.
Housing the extremely-low income population (below 30% of area median income) can be especially challenging. HUD's CHAS
dataset provides a wealth of information on such households in Palm Desert. The above table provides a breakdown of extremely
low income households by race and ethnicity. The race/ethnicity with the highest share of extremely-low income households in
Palm Desert is Asian and other, non-Hispanic (15% compared to 11.9% of total population). In the SCAG region, the highest share
of extremely-low income households is Black, non-Hispanic (27.1% compared to 17.7% of total households).
0%
10%
20%
30%
40%
50%
60%
70%
80%
90%
100%
Less than
$20,000
$20,000 to
$34,999
$35,000 to
$49,999
$50,000 to
$74,999
$75,000 to
$99,999
$100,000 or
more
Above $500,000
305 237 264 281 288 1888
$200,000 to $500,000
968 1209 839 1684 1153 3075
$100,000 to $200,000
334 265 261 343 146 154
Below $100,000
1096 215 221 127 73 248
Owner-occupied households
Household Income; Home Value
Prepared by SCAG, Updated April 2021 Page 17/18
LOCAL HOUSING DATA, 6TH CYCLE HOUSING ELEMENT UPDATE
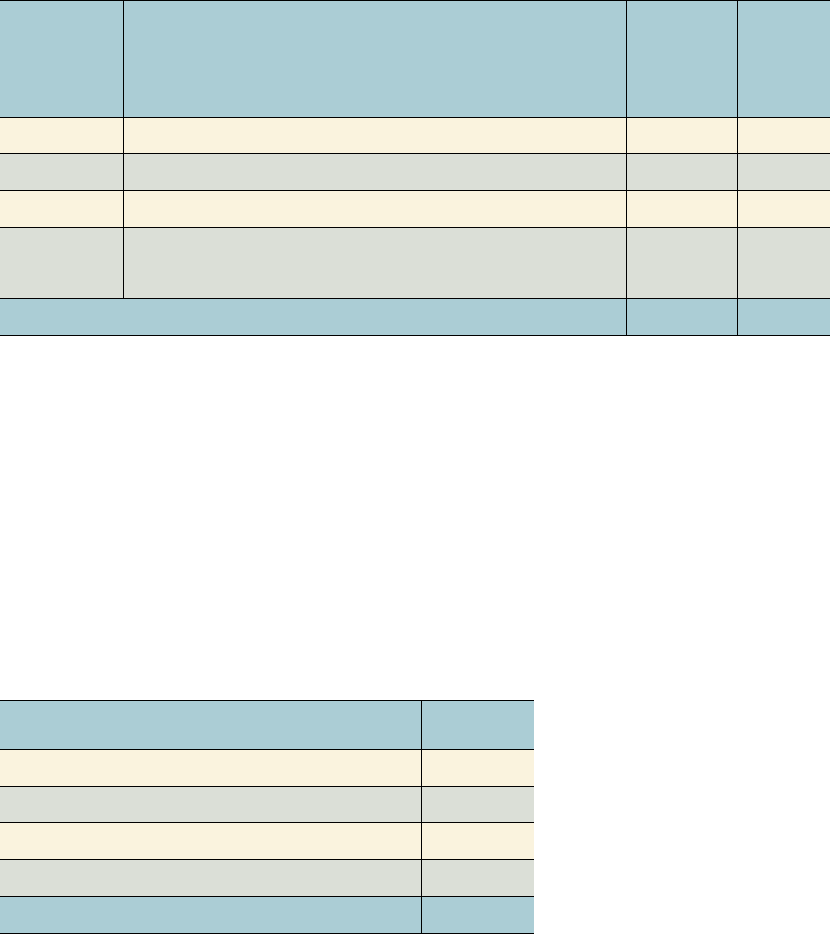
Assisted Units at Risk of Conversion
Risk Level Definition:
Low-income
units in
jurisdiction
Percent of
county's low-
income units
Very High At-risk of converting to market rate within the next year 0 0%
High At-risk of converting to market rate in the next 1-5 years 0 0%
Moderate At-risk of converting to market rate in the next 5-10 years 0 0%
Low 240 100%
TOTAL 240 100%
Final 6th Cycle Regional Housing Needs Allocation for Palm Desert:
Units
Very-Low Income (<50% of AMI) 675
Low Income (50-80% of AMI)
460
Moderate Income (80-120% of AMI) 461
Above Moderate Income (>120% of AMI)
1,194
TOTAL 2,790
VII. ASSISTED UNITS AT RISK OF CONVERSION
At-risk of converting to market rate in the next 10 or more years
and/or are owned by a large/stable non-profit, mission-driven
developer.
California Housing Partnership, July 2020. Includes HUD, Low-Income Housing Tax Credit (LIHTC), USDA, and CalHFA projects. Subsidized or assisted
developments that do not have one of the aformentioned financing sources may not be included.
The California Housing Partnership (CHP) provides data on assisted housing units and assesses the level of risk to converting to
market rate. These data identify homes without a known overlapping subsidy that would extend affordability beyond the indicated
timeframe and unless otherwise noted are not owned by a large/stable non-profit, mission-driven developer. Detailed 2019 data
can be found in SCAG's RHNA data appendix at http://scag.ca.gov/programs/Documents/RHNA/SCAG-Final-RHNA-Data-Appendix-
030520.pdf. Complete, updated data can be requested from CHP through Danielle Mazzella, Preservation & Data Manager
VIII. REGIONAL HOUSING NEEDS ALLOCATION
SCAG, 2021. Based on SCAG's 6th cycle FInal RHNA Allocation, adopted March 2021. Please note that for the housing element update, local jurisdictions
will have to consider extremely low income (ELI) households as well. ELI housing needs may be calculated either by using Census data or simply
assuming that 50 percent of the very low income households qualify as extremely low income households.
Prepared by SCAG, Updated April 2021 Page 18/18
MAJOR DATA SOURCES USED
DESCRIPTION FOR MORE INFORMATION, PLEASE SEE
ACS American Community Survey 2014-2018
5-year estimates
www.data.census.gov
DOF CA DOF E-5 Population and Housing Unit
Estimates
www.dof.ca.gov/forecasting/demographics/
CHAS HUD CHAS, 2012-2016 www.huduser.gov/portal/datasets/cp.html
CA DDS California Department of Developmental
Services
www.dds.ca.gov/transparency/
SCAG LOCAL
PROFILES
Including Construction Industry Research
Board (CIRB) and Core Logic/DataQuick
www.scag.ca.gov/DataAndTools/Pages/LocalProles.aspx
REGIONAL OFFICES
IMPERIAL COUNTY
1503 North Imperial Ave., Ste. 104
El Centro, CA 92243
Tel: (213) 236-1967
ORANGE COUNTY
OCTA Building
600 South Main St., Ste. 741
Orange, CA 92868
Tel: (213) 236-1997
RIVERSIDE COUNTY
3403 10th St., Ste. 805
Riverside, CA 92501
Tel: (951) 784-1513
SAN BERNARDINO COUNTY
1170 West 3rd St., Ste. 140
San Bernardino, CA 92410
Tel: (213) 236-1925
VENTURA COUNTY
4001 Mission Oaks Blvd., Ste. L
Camarillo, CA 93012
Tel: (213) 236-1960
MAIN OFFICE
900 Wilshire Blvd., Suite 1700
Los Angeles, CA 90017
Tel: (213) 236-1800
www.scag.ca.gov
please recycle AJ 2952
